Stats on international development: how UK aid was spent in 2018
The Department for International Development (DFID) has released the annual Statistics on International Development report, which provides preliminary statistics on how much Official Development Assistance (ODA) the UK provided in 2018.
The report includes UK ODA as a proportion of Gross National Income (the ODA:GNI ratio), which has hit the 0.7% spending target.
Highlights
The UK met the 0.7% ODA/GNI target in 2018 with the provisional ratio at 0.70%.
UK aid increased to £14,546m in 2018, up from £14,059m in 2017, an increase of £487m (3.5%). This £487m increase was less than the £652m (5.1%) increase in 2017.
Multilateral and bilateral ODA:
- The split between direct multilateral and bilateral aid remained relatively steady, with bilateral ODA at 63.5% of total ODA (2017: 62.4%) and core contributions to multilaterals at 36.5% of ODA (2017: 37.6%).
- Bilateral aid grew faster in relative terms at 5.0% (£439m) to £9,242m (2017: £8,803m), with core multilateral aid increasing by 0.9% (£48m) to £5,304m (2017: £5,256m).
- The estimated UK share of the EU developmental budget in 2018 was £952m. This represented an increase of £41m from £911m in 2017, driven by changes in EU disbursements and exchange rate movements.
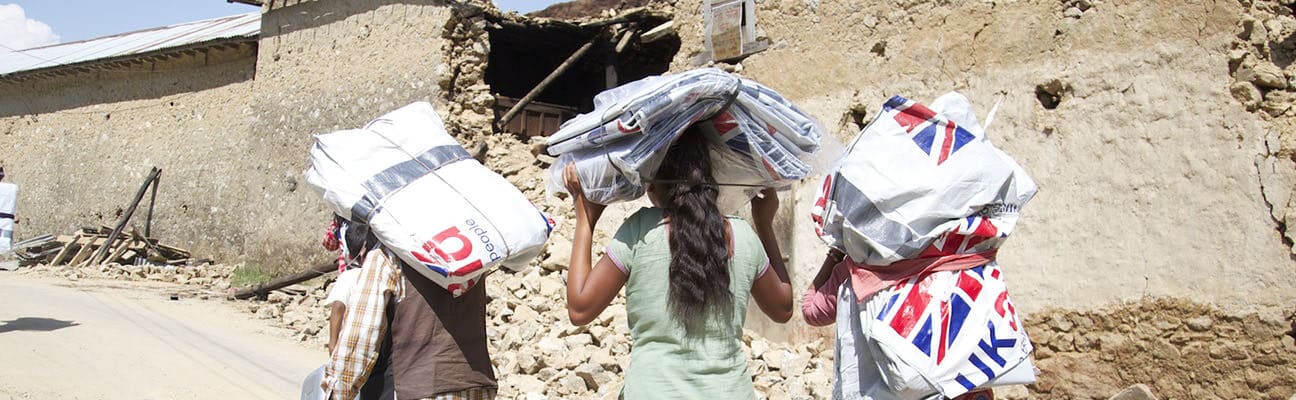
- Of total UK bilateral ODA, £1,265m (13.7%) was for humanitarian assistance, representing a decrease of £178m since 2017.
How did departments spend ODA?
DFID’s relative share of the total aid budget it manages increased to 74.9%, up from 71.9% in 2017 and 73.8% in 2016. In absolute terms, this represented an increase of £792m (7.8%).
Subscribe to our newsletter
Our weekly email newsletter, Network News, is an indispensable weekly digest of the latest updates on funding, jobs, resources, news and learning opportunities in the international development sector.
Get Network NewsThe relative share of aid that other government departments and other non-departmental contributors (such as EU expenditure not attributed to DFID, and the IMF Poverty Reduction and Growth Trust) manage fell to 25.1% of total ODA (2017: 28.1%), however the percentage spent by other government departments alone rose to 20.3% of total ODA (2017: 18.2%).
Significant non-DFID departmental allocations include:
- Business, Energy & Industrial Strategy (BEIS) – 5.8% of total ODA (5.4% in 2017)
- Foreign & Commonwealth Office (FCO) – 4.4% of total ODA (4.5% in 2017)
- Conflict, Stability and Security Fund (CSSF) – 4.2% of total ODA (3.9% in 2017)
- Home Office – 2.3% of total ODA (2.4% in 2017)
- Department of Health and Social Care – 1.3% of total ODA (0.7% in 2017)
- Non-department sources (items not on any departments’ budget) included the non-DFID EU attribution (3.2% or £468m) and the IMF Poverty Reduction and Growth Trust (PRGT), which fell dramatically to £26m (0.2%) from £726m (5.2%) in 2017.